About

Hello there! I'm Shehjar Raina, a recent MS Business Analytics grad from Arizona State University, where I proudly graduated with distinction. I craft a valuable blend of education, analytics skills, and some real-world experience.
I've been working in the analytical domain for around 3 years, where I have worked with Penta Software , an IT Solution Provider, as a Business Analyst. In this role, I conducted monthly and quarterly analysis of employee attrition data and developed management dashboards by extracting and validating data using complex SQL queries. I have led various internal projects while collaborating with Operations and HR teams.
During my time at ASU, I had some exciting projects on my plate. One standout was my work with PetSmart , where I developed an NLP-based classification model. The main goal of this project was to decipher the sentiment hidden within tweets and extract customer insights from the chatter. I also created intuitive and interactive Tableau Dashboards, providing a glimpse of the competitor behavior along with identifying trends in real-time.
There you have it - a snapshot of who I am and what I've been up to.
Thanks for stopping by!
SQL | PYTHON | TABLEAU | MICROSOFT SUITE
LEAN SIX SIGMA GREEN BELT
Education
Master of Science in Business Analytics
Arizona State University - W.P. Carey School Of Business
Aug 2022 - May 2023
Master of Business Administration
Amity University
Jul 2016 - May 2018
Bachelor of Arts - Economics
University of Delhi
Jul 2013 - May 2016
Professional Experience
Arizona State UniversityJul 2023 - Present
Research Assistant Phoenix, AZ
- Conducted a comprehensive literature review on sourcing, contracting, and managing several types of technologies in digital procurement seeking to understand business problems, identifying key drivers and factors for successful integration.
- Analyzed interviews with CPOs of ten large scale companies to collect industry insights and trends in digital procurement tools, creating a roadmap for procurement digitization.
PetSmartJan 2023 - May 2023
Business Analyst Intern Phoenix, AZ
- Led a team of four people to build scalable, end-to-end automated social media analytics pipeline using Python that analyzes
unstructured Twitter data through web scraping with Tweepy API, enabling real-time tracking of customer insights from key
discussion topics through sentiment analysis.
- Deployed four Power BI Dashboards capable of identifying trends in real-time, comparing the performance with top competitors and
guiding business decisions, leading to cost savings opportunities of around $500K.
Penta SoftwareDec 2019 - Jul 2022
Business AnalystGurgaon, India
- Designed and monitored Tableau dashboards by identifying, analyzing, and maintaining key metrics, resulting in a 20% improvement in data accuracy and visualization efficiency.
- Programmed complex SQL queries to extract, manipulate and analyze attrition data for employees serving overseas clients, allowing
for proactive recruitment strategies that reduced turnover by 10%. Achieved approximately $20K in cost savings by mitigating
recruitment and training expenses, while ensuring seamless continuity of client relationships.
- Designed, developed, and tested a weekly alert system that identified high and low-performing agents, leading to informed staffing
decisions, and contributing to a 15% increase in overall agent productivity.
- Collaborated with other managers and analysts to continuously improve operations by determining performance metrics and optimal
compensation incentives, reducing the time spent on compensation determination by 50%.
- Headed collaboration with clients and stakeholders for requirement gathering, delivering high quality data analytics and reports
leading to effective communication of insights.
- Worked in an Agile development environment and used Jira for project management.
Grapes DigitalJan 2019 - Oct 2019
Finance ExecutiveDelhi, India
- Generated comprehensive billing and payment reporting dashboard consolidating AR/AP data retrieved and aggregated from large
SAP datasets to improve cash flow projection accuracy, manage budget for projects and reduce invoicing errors by 20%.
- Utilized advanced Excel skills to create a centralized contract renewal tracking system with automated alerts and expiration date
reminders reducing missed renewal deadlines by 70% through systematic tracking.
- Developed and implemented a new cross-functional communication process using SharePoint for centralized inquiry tracking,
reducing average inquiry response time by 40% through improved task management and transparency.
Projects
I have delved into various areas within the field of data science. Through my projects, I've leveraged the power of Business Intelligence, Machine Learning, Lean Six Sigma, and Deep Learning to solve real-world problems and drive process improvement through data-driven decision making.
Business Intelligence & Insights
HR Analytics
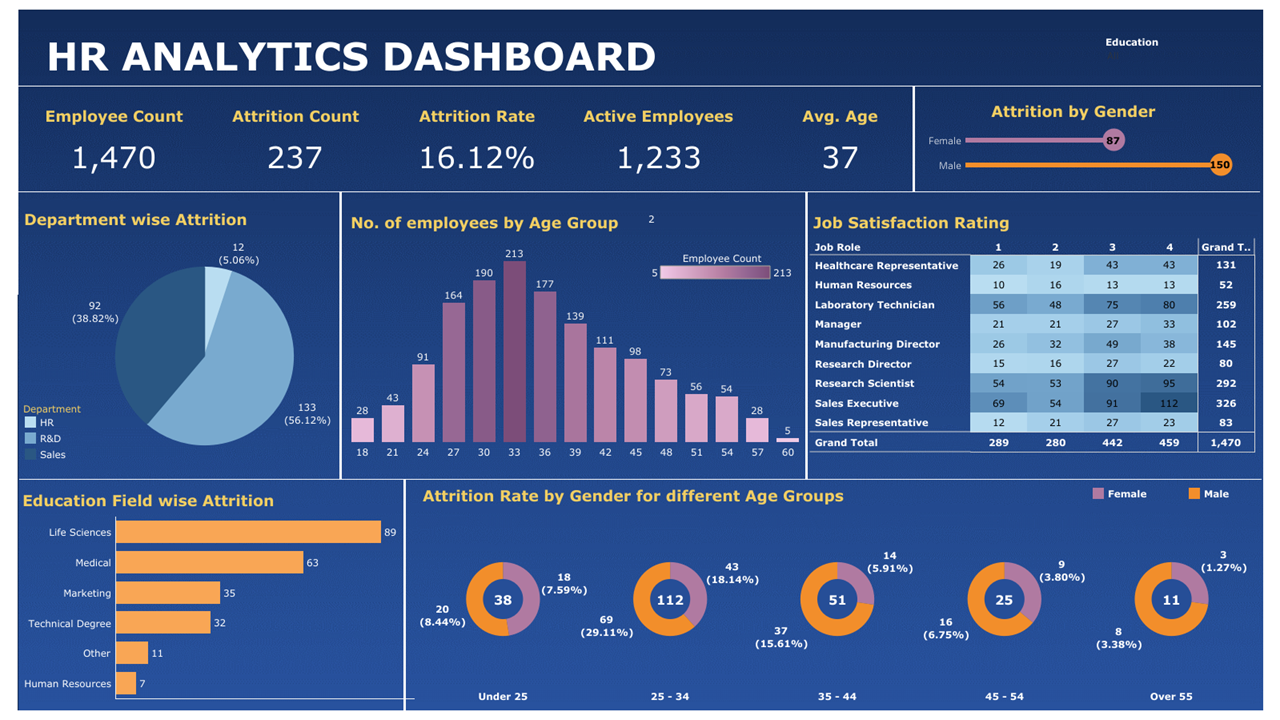
- The HR Analytics Dashboard offers a comprehensive view of key HR metrics, enabling stakeholders to make informed decisions regarding workforce management and performance.
- At the forefront of this dashboard are essential HR metrics, including employee headcount, turnover rate, and recruitment efficiency.
- Tableau: HR Analytics
Sales Dashboard
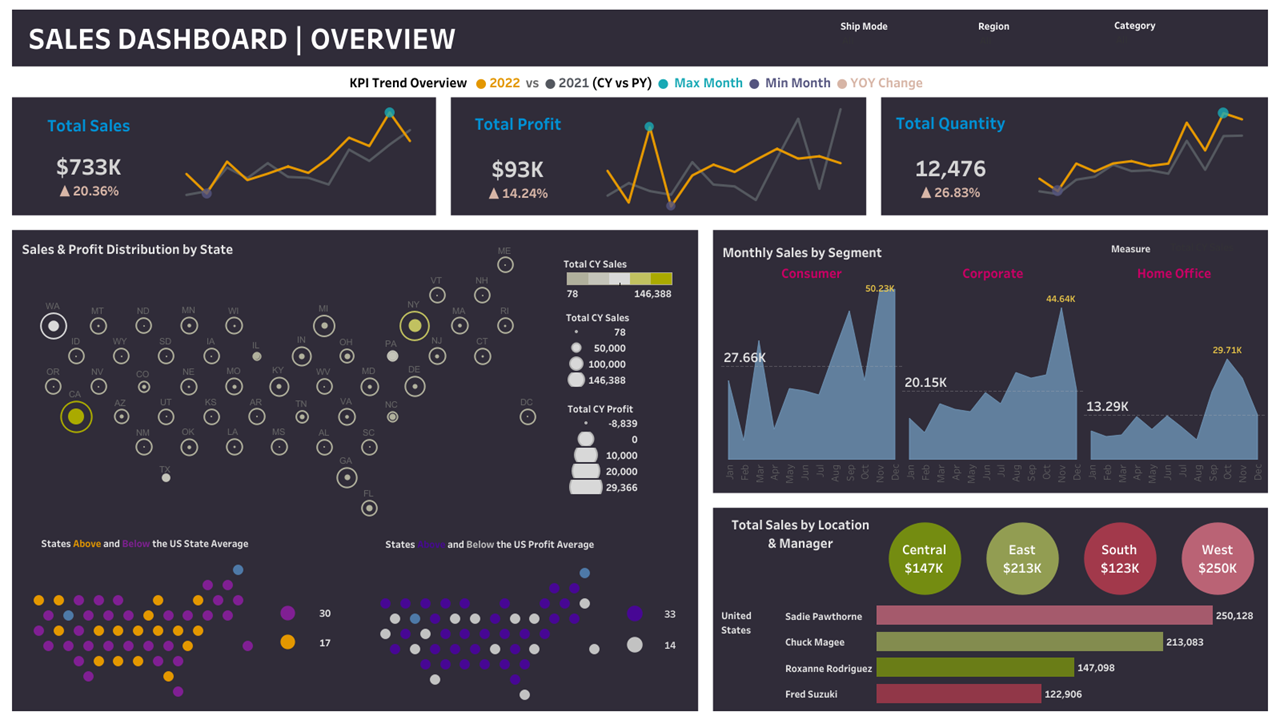
- The Sales Dashboard presented here serves as a pivotal tool for comprehensive business analysis. Designed with precision, it provides invaluable insights into essential sales and profit metrics, as well as product quantity, enabling stakeholders to assess the overall health of the company.
- This dashboard prominently displays critical Key Performance Indicators (KPIs) such as Total Sales, Total Profit, and Total Quantity, offering a holistic view of the organization's performance.
- A distinctive feature of this dashboard is its ability to compare current data with figures from the previous year, expressed as percentages.
- The inclusion of intuitive and interactive graphical representations enhances data visualization. These graphs reveal sales and profit trends across various states in the United States, facilitating in-depth regional analysis.
- For a deeper understanding of customer preferences and to shape tailored marketing strategies, this dashboard presents sales and profit figures for the current year segmented by customer groups.
- The dashboard incorporates location-based sales data, complemented by corresponding manager performance metrics. This feature empowers businesses to optimize sales operations and enhance overall performance by assessing manager effectiveness in different regions.
- In conclusion, this Sales Dashboard is a meticulously crafted tool that empowers data-driven decision-making, offering a formal and detailed perspective on the company's performance.
- Tableau: Sales Analytics
Road Accidents Dashboard
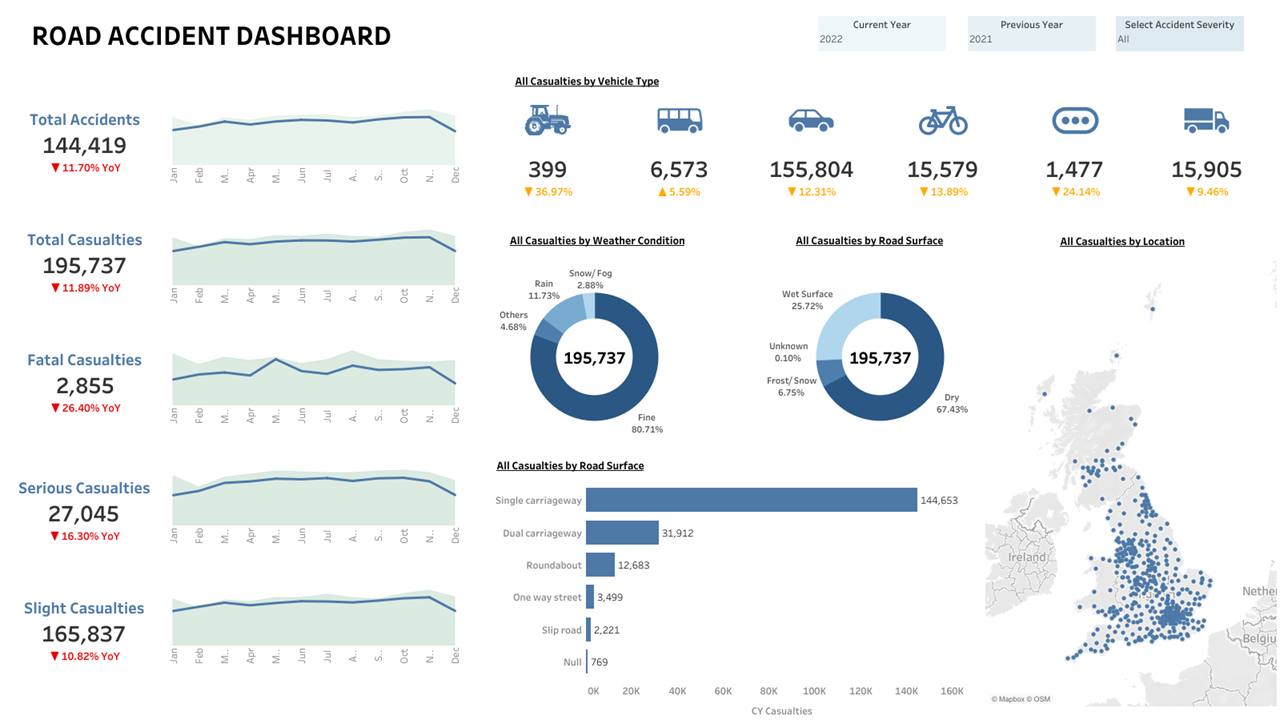
- The Dashboard provides a comprehensive analysis of road accidents over the years, with an interactive user experience. Utilizing parameters and calculated fields, the dashboard presents data on accident severity, road types, weather conditions, and locations, offering valuable insights for improvement.
- Key Performance Indicators (KPIs): Accidents, Casuality, and Casualty/Accident ratio.
- One standout finding highlights a high number of accidents on single-carriageways in dry weather conditions, suggesting the need to address reckless driving behaviors by small car drivers. The dashboard's visualizations, including bar charts, sparklines, and donut charts, allow stakeholders to explore accident trends and take proactive measures for road safety.
- The dashboard targets various stakeholders, including transport departments, police, emergency services, and road safety agencies. The project's development involved data cleaning, processing, analysis, and visualization to create a powerful tool for driving positive change in road safety. The Road Accident Dashboard is a valuable resource for understanding and addressing road accidents, working towards safer environments for all road users.
- Tableau: Road Accident Dashboard
Machine Learning : Regression/Classification
Fraud Detection
- This project focuses on developing a robust Fraud Detection system, leveraging machine learning techniques to identify and prevent fraudulent activities in financial transactions.
- The primary goal is to reduce the occurrence of fraudulent transactions being mistakenly classified as regular ones.
- Github: Fraud Detection
Homesite Quote Conversion
- In this project, we aimed to predict QuoteConversion_Flag for potential Homesite policy customers using a dataset covering various customer and policy details.
- After data cleaning and addressing class imbalance with SMOTE, we transformed categorical data and built individual models (e.g., Decision Tree, Random Forest, SVM) with hyperparameter tuning.
- To enhance accuracy, we created an ensemble model combining multiple classifiers, resulting in an impressive accuracy rate surpassing 90%.
- Github: Homesite Quote Conversion
LEAN SIX SIGMA
Student Survey Engagement using Lean Six Sigma
- The main objective of this project was to significantly increase the response rate of student surveys. The aim was to identify the root causes of defects in the survey process, which hindered student engagement. I employed Lean Principles and the DMAIC (Define, Measure, Analyze, Improve, Control) methodology to delve into the survey's intricacies.
- Through these efforts, we achieved an impressive 25% increase in the survey response rate. I designed and implemented Tableau dashboards that provided real-time insights into survey drop rates at each step. These dashboards enabled us to proactively identify bottlenecks and mitigate risks, ultimately driving improvements in the survey process.
Gentech Lean Six Sigma Case Study
- Designed a Tableau dashboard to identify KPI’s of defective transactions and implemented Lean Six Sigma techniques including root cause analysis to drive cost, speed, and capacity improvements to reduce cycle time by 15% and increasing revenue by 8%.
Deep Learning & Computer Vision
Workout Detection Model
- Developed a Python-based CV model integrated into a Streamlit web app that identifies user-uploaded yoga/exercise poses and intelligently directs them to relevant YouTube tutorials.
Extra-curriculars
Leadership & Volunteer Work

- Member of Beta Gamma Sigma Honor Society
- Event Production Lead at TEDx Manipal University Jaipur
- Spearheaded a team of 20 students to procure production equipment and manage TEDx event guidelines for TEDxManipalUniversity Jaipur.
- Coordinated rehearsal activities for 10 speakers, customizing stage ambience and audio preferences for each speaker in collaboration with the Curation team.
- President of Music Society at Manipal University Jaipur
- Led and directed a dynamic core team of 5, successfully organizing 12 events at Intra and Inter-College festivals, providing a platform for ~200 club members to showcase their talents.
- During my term as president, the club excelled, earning more than 20 awards at various Inter-College Competitions. Additionally, conducted regular Mentorship Classes to guide students in mastering musical instruments and vocals
- Executive Committee of Oneiros Cultural Festival at Manipal University Jaipur
- Oversaw a team of 60 members in organizing main-stage events such as Artist Night and War of Bands, handling all aspects from artist contracts to financial matters, while attracting an impressive footfall of around 7000 students.
- Collaborated with other executive members to strategize sponsorship, logistics, hospitality, and festival promotions for annual cultural festival.
Certificates & Achievements
- Best MSBA Capstone Project Arizona State University
- Quarterly Excellence Award Maruti Suzuki India Limited
- NLP - Natural Language Processing using Python Udemy
- SQL Basic, Intermediate, Advanced HackerRank
- Data Science: R Basics HarvardX on edX
- Machine Learning with MATLAB MathWorks
- MATLAB Onramp MathWorks
- Introduction to SQL DataCamp
- Introduction to Python DataCamp
- Introduction to Java Hewlett Packard
Elements
Text
This is bold and this is strong. This is italic and this is emphasized.
This is superscript text and this is subscript text.
This is underlined and this is code: for (;;) { ... }. Finally, this is a link.
Heading Level 2
Heading Level 3
Heading Level 4
Heading Level 5
Heading Level 6
Blockquote
Fringilla nisl. Donec accumsan interdum nisi, quis tincidunt felis sagittis eget tempus euismod. Vestibulum ante ipsum primis in faucibus vestibulum. Blandit adipiscing eu felis iaculis volutpat ac adipiscing accumsan faucibus. Vestibulum ante ipsum primis in faucibus lorem ipsum dolor sit amet nullam adipiscing eu felis.
Preformatted
i = 0;

while (!deck.isInOrder()) {
    print 'Iteration ' + i;
    deck.shuffle();
    i++;
}

print 'It took ' + i + ' iterations to sort the deck.';
Lists
Unordered
- Dolor pulvinar etiam.
- Sagittis adipiscing.
- Felis enim feugiat.
Alternate
- Dolor pulvinar etiam.
- Sagittis adipiscing.
- Felis enim feugiat.
Ordered
- Dolor pulvinar etiam.
- Etiam vel felis viverra.
- Felis enim feugiat.
- Dolor pulvinar etiam.
- Etiam vel felis lorem.
- Felis enim et feugiat.
Icons
Actions
Table
Default
| Name |
Description |
Price |
| Item One |
Ante turpis integer aliquet porttitor. |
29.99 |
| Item Two |
Vis ac commodo adipiscing arcu aliquet. |
19.99 |
| Item Three |
Morbi faucibus arcu accumsan lorem. |
29.99 |
| Item Four |
Vitae integer tempus condimentum. |
19.99 |
| Item Five |
Ante turpis integer aliquet porttitor. |
29.99 |
|
100.00 |
Alternate
| Name |
Description |
Price |
| Item One |
Ante turpis integer aliquet porttitor. |
29.99 |
| Item Two |
Vis ac commodo adipiscing arcu aliquet. |
19.99 |
| Item Three |
Morbi faucibus arcu accumsan lorem. |
29.99 |
| Item Four |
Vitae integer tempus condimentum. |
19.99 |
| Item Five |
Ante turpis integer aliquet porttitor. |
29.99 |
|
100.00 |